

Summary of SnapChat IPO price trend so far:
- Post their IPOs, tech companies go through 4 phases: Euphoria, Pessimism, Optimism, and Realism.
- Snap Inc is obviously in the Euphoria stage.
- Price data of 7 big tech IPOs show that most companies stay below their listing price in the first 180 days after IPO. The only exception from the companies analysed is Google.
- Two key factors to keep in mind – the IPO lock-up period which is up to one year, and the company is expected to announce their quarterly earnings on 20 April 2017. The stock may be very volatile around these dates.
- At the price of $27, the stock is trading at a market capitalisation of $35bn. The company generated $404m in revenue in 2016 up from $59m in 2015. They spent $924m resulting in a net loss of $514m in 2016. Analysts and investors who are recommending or buying the stock at this price are hoping that the company will continue to grow aggressively even in the face of competition from Facebook, Instagram and others.
- I’ll be looking to buy put options on Snap Inc as and when derivatives trading begins.
- You can keep track of all relevant news and tweets on Snap Inc on our multi-award winning platform CityFALCON here.
Back in 2014, I did a similar analysis on Twitter; see the full article here. It turned out that Twitter did end up going the way of Groupon and Zynga which has not been great for investors.
My original thesis from 2014 still seems to be valid. Technology IPOs have shown some similarities in their post-listing price movement. They all seem to have gone through 4 phases:
- Initial ‘euphoria’ with everyone trying to get their hands on the shares, and with analysts setting unrealistic expectations and justifying high valuations;
- A state of ‘pessimism’ after companies fail to meet the early unrealistic expectations, and a reduction in exposure by funds and institutions;
- ‘Recovery and optimism’ once the company starts beating the low expectations, and
- ‘Realism’ setting in, and the stock trying to find its fundamental value.
For the 7 companies we analysed, the longer term chart shows how Facebook has been the real winner even after a poor start in the first year after the IPO. Groupon, Twitter and Zynga have struggled to be anywhere close to the listing price after the initial euphoria period. Alibaba and Square are above their listing price but these are relatively early days.
For ease of comparison, in the charts below, the day 1 closing price (and NOT the IPO price) is indexed to 100.
There are several other factors that could have affected the price trends and the day 1 closing price, including availability of quality tech stocks at IPO, the geopolitical situation, and economic activity. However, we ignore these for the purposes of this analysis.
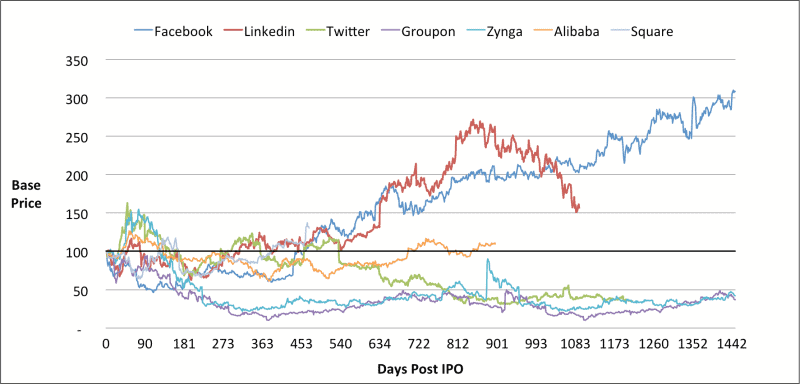
Source: Yahoo Finance, own analysis
If we look at the chart for the first year after listing, it shows that only Linkedin and Twitter managed to stay above the listing price for a significant period leading up to the one year mark.
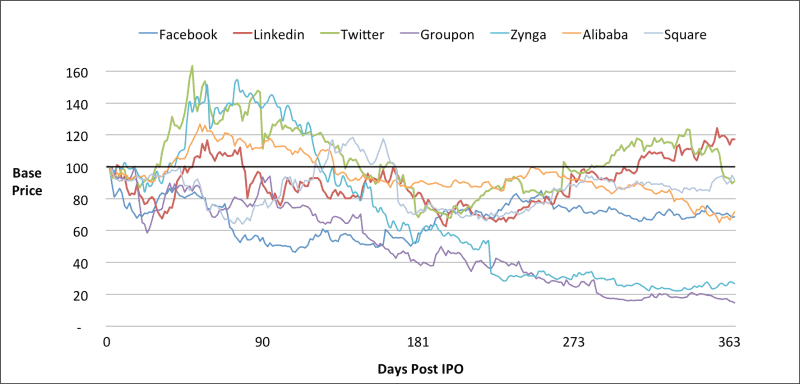
Source: Yahoo Finance, own analysis
What is the most interesting, though, is how these IPOs performed in the first 180 days after listing. Most were trading significantly lower than their listing price.
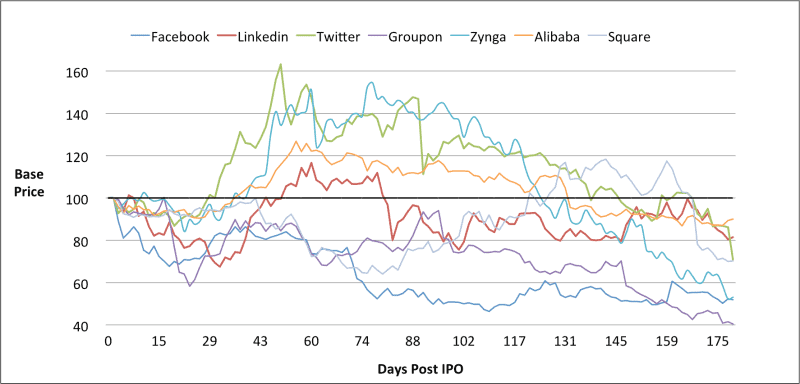
Source: Yahoo Finance, own analysis
The only exception that we found that didn’t fit into this analysis was Google. What a star! Not only at the 180 days mark, but years later it is still up.
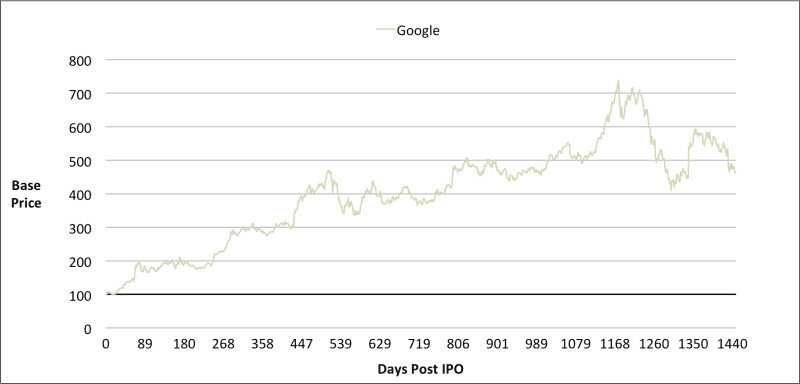
Source: Yahoo Finance, own analysis
Watch out for the lock-up period
An IPO lock-up period is a contractual restriction that forbids insiders who are holding a company’s stock, before it goes public, from selling the stock for a period, which usually lasts 90 to 180 days after the company goes public.
At the end of the lockup period, you may see some of the insiders and early investors liquidating the shares which could put downward pressure on the stock.
In the case of Snap, it seems that they have kept the lock-up period for some investors at a year, which is much higher than the standard of 180 days. This is a good step by the company to show faith in their IPO and attract quality investors who believe in the future of the company rather than just punters.
Summary
Snap Inc could continue to rally the way Google did but I’m sure that I’m not the only one that believes that the hype behind Snap Inc sounds similar to what we had seen for Groupon. Even the long-term outperformer, Facebook, struggled in the first 180 days after listing. I’ll be looking to buy and add put options to my portfolio if the rally for Snap Inc continues, with my target being to get out in the first 180 days.
You can keep track of all relevant news and tweets on Snap Inc on our multi-award winning platform CityFALCON here
Leave a Reply