

Note: Retrieving the data from the regulatory filings is an ongoing process at the time of this publication. We estimate the ~5 million filings to be fully processed in a couple of weeks. Until then, please be aware that some insider transaction content may be missing.
You might have heard that it is difficult for small investors to beat the markets. One of the main reasons is that small investors have an informational disadvantage. CEOs, CFOs, management, and directors are the first to know about possible headwinds or tailwinds to come, as well as other aspects not known to the public yet. At CityFALCON, we have built a tool to help level the playing field.
This informational edge insiders have is based on a deeper understanding of their businesses, the industry opportunities/risks, and insider information about product launches, internal issues, etc.. While insider trading laws prevent egregious abuse, insiders are allowed to trade on more ambiguous knowledge, such as slowing orders, the appearance of a new dangerous competitor, or nebulous issues affecting the successful development of a new product. Equally, insiders might be aware of great new opportunities, or the possibility of a promising deal, or a turn-around for their distressed business. The big problem for the small investor is that these insiders know in advance, while the small investor is the last to know.
CityFALCON’s promise is to democratise the financial content space, and thus we have created a new tool that presents and analyses what those high in the insider hierarchy do. Actions are more important than words, and though a CEO may decorate the annual report with promising statements, does he put his money where his mouth is?
To promote fairer and more efficient markets, the regulatory authorities (e.g. Securities & Exchange Commission – SEC in the US) require that insiders report when they buy/sell their stocks and exercise options. However, these raw data are difficult to evaluate and use, because they sometimes include a myriad of unstructured documents, which also differ from jurisdiction to jurisdiction.
Our Insider Transactions tool aggregates the data from 5 million filings stretching back to 1996 (at first launch and we’ll add more over time), and apart from providing the data in structured form, delivers analytics and insights. Retail users can avail of these on our web and mobile platforms, and our enterprise and fintech clients can use our API.
For example, you, as a user, get the number of sells, buys, and exercised stock options for different periods, further broken down for each insider. In addition, it is easy to have access to some important comparison metrics, like the average selling/buying price of these aggregated transactions for different periods and the average stock price for that period. In the near future, we’ll be launching similar information for key people, such as the famous insiders Elon Musk or Sergey Brin, so you can track them, too. Moreover, we’ll have insider activity comparisons between companies, so you can track industry and corporate trends.
A Real Example
Let’s take a real example to see how the real-time Insider Transactions data tool works on our platform. For Tesla (TSLA), our Buy/Sell ratio indicates that insiders have mostly sold the stock. With overwhelming sales volumes recently, more selling than buying is true for any period (3M, 1Y, 5Y, ALL) we choose.
Simple Buy/Sell Ratio for different periods
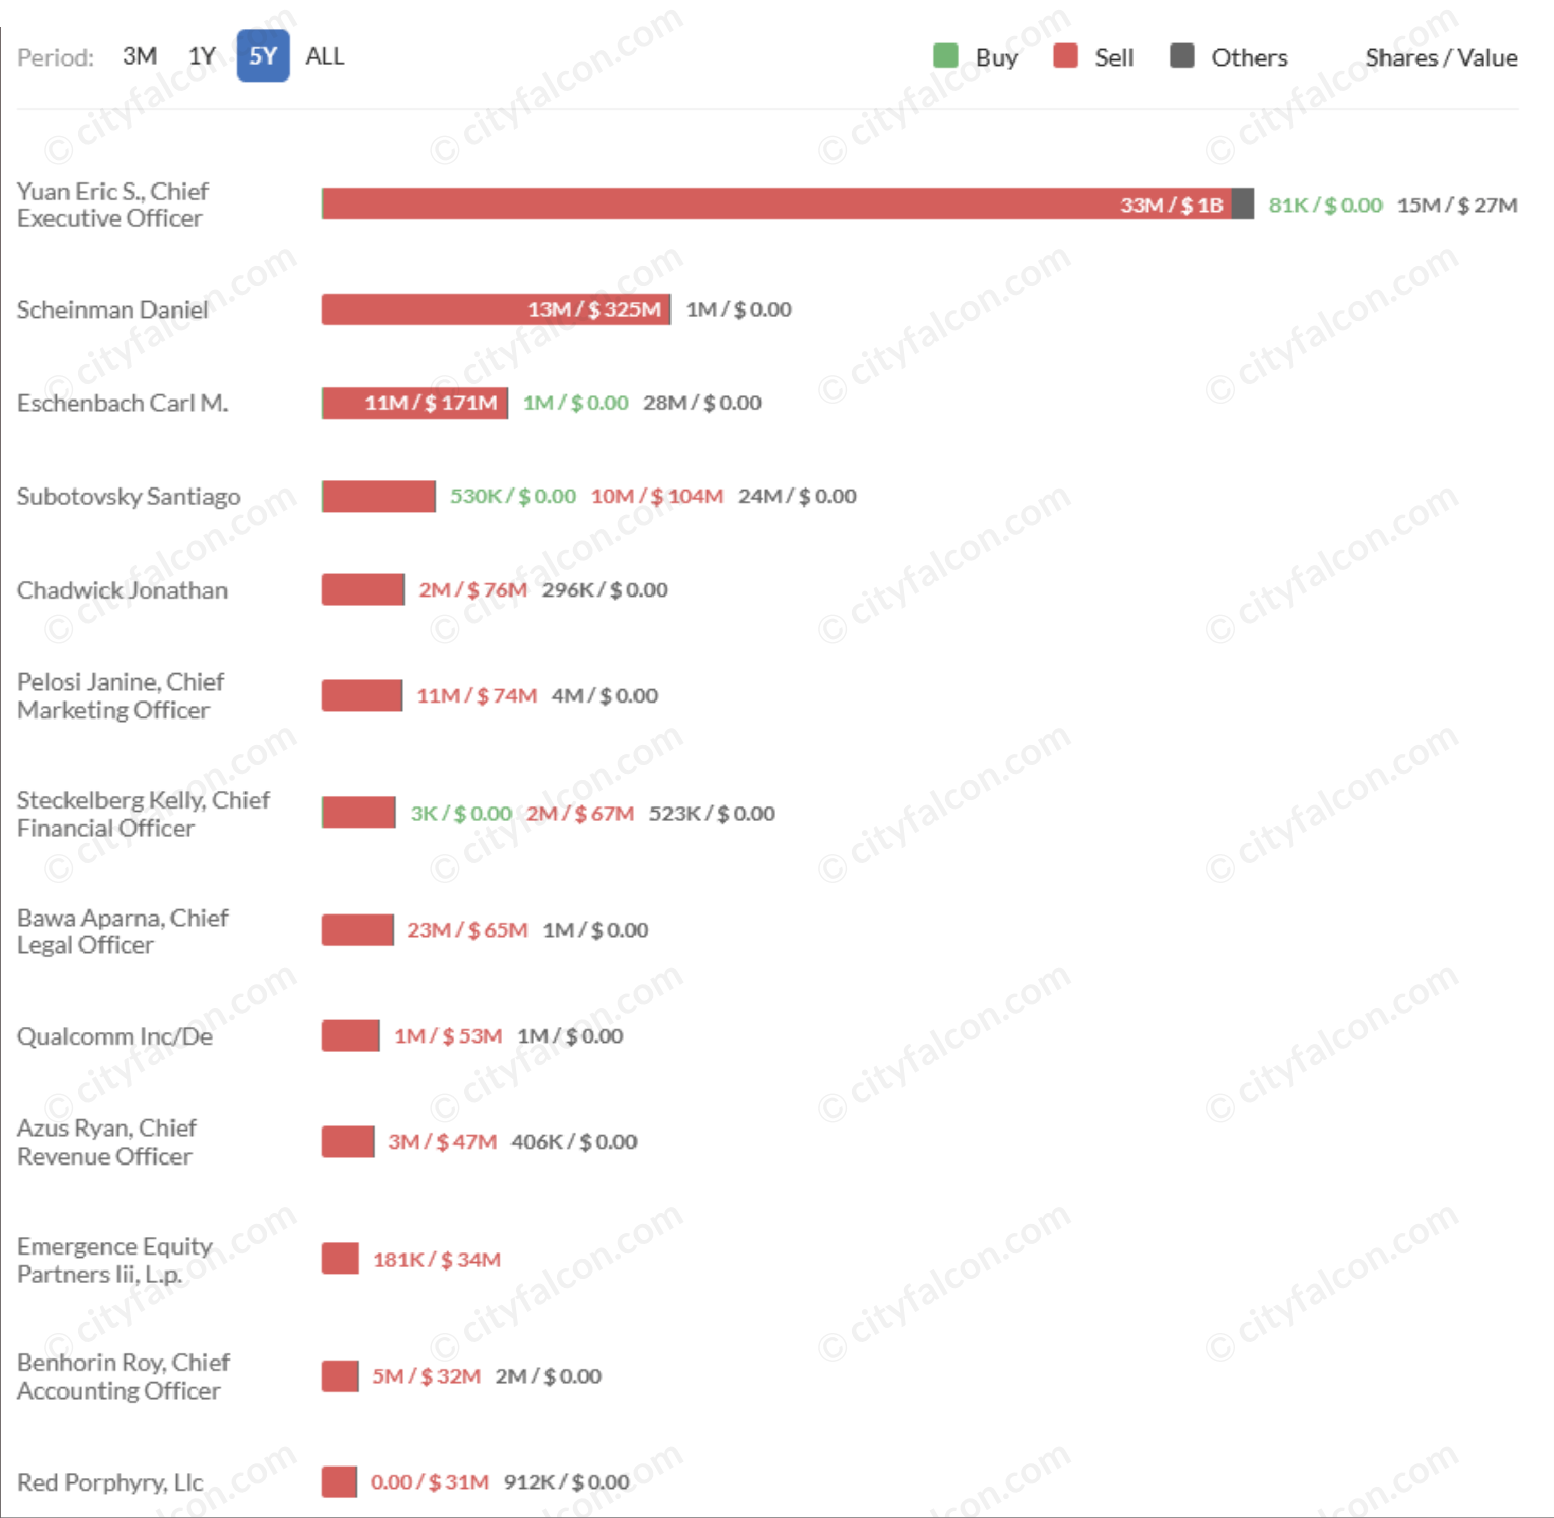
The next step is to find out who is selling. The aggregated transactions for the past 12 months reveal that the CEO, Elon Musk, is mainly responsible, having sold shares worth the enormous value of $32 billion. They also show that other insiders are also sellers. The top insider shareholder section next to it will help you see things in a broader context, understand the significance of these transactions for the individual seller, and know how heavily each insider is invested in the company. According to the story, and your investing strategy, there are different ways to see this.
Aggregated Transactions of Tesla Insiders during the past year
Why did Elon Musk Sell Tesla Shares?
There is more to analyse before you better understand the situation. The graph containing the share price evolution and the insider transactions clearly shows that the insiders, and mainly Elon Musk, started selling most of their shares shortly after the peak around $370 (having been adjusted for splits).
Tesla’s Insider Transactions in the previous 5 years
As the greatest investors do, insiders do not necessarily buy or sell just on headwinds/tailwinds and bad/good information. The valuation enters into the equation. If the stock price is so high to that is reflects more than what is reasonably achievable, they may think of selling. This is a factor that might have triggered, or partly influenced, the way Elon Musk, and Tesla’s top management, has transacted over the past 12 months.
In addition, this has been a period of economic weakness. Inflation, and the increasing interest rates, damaged tech companies’ abilities to keep their stocks rising and raising more capital. There were many signs that the party was coming to a close.
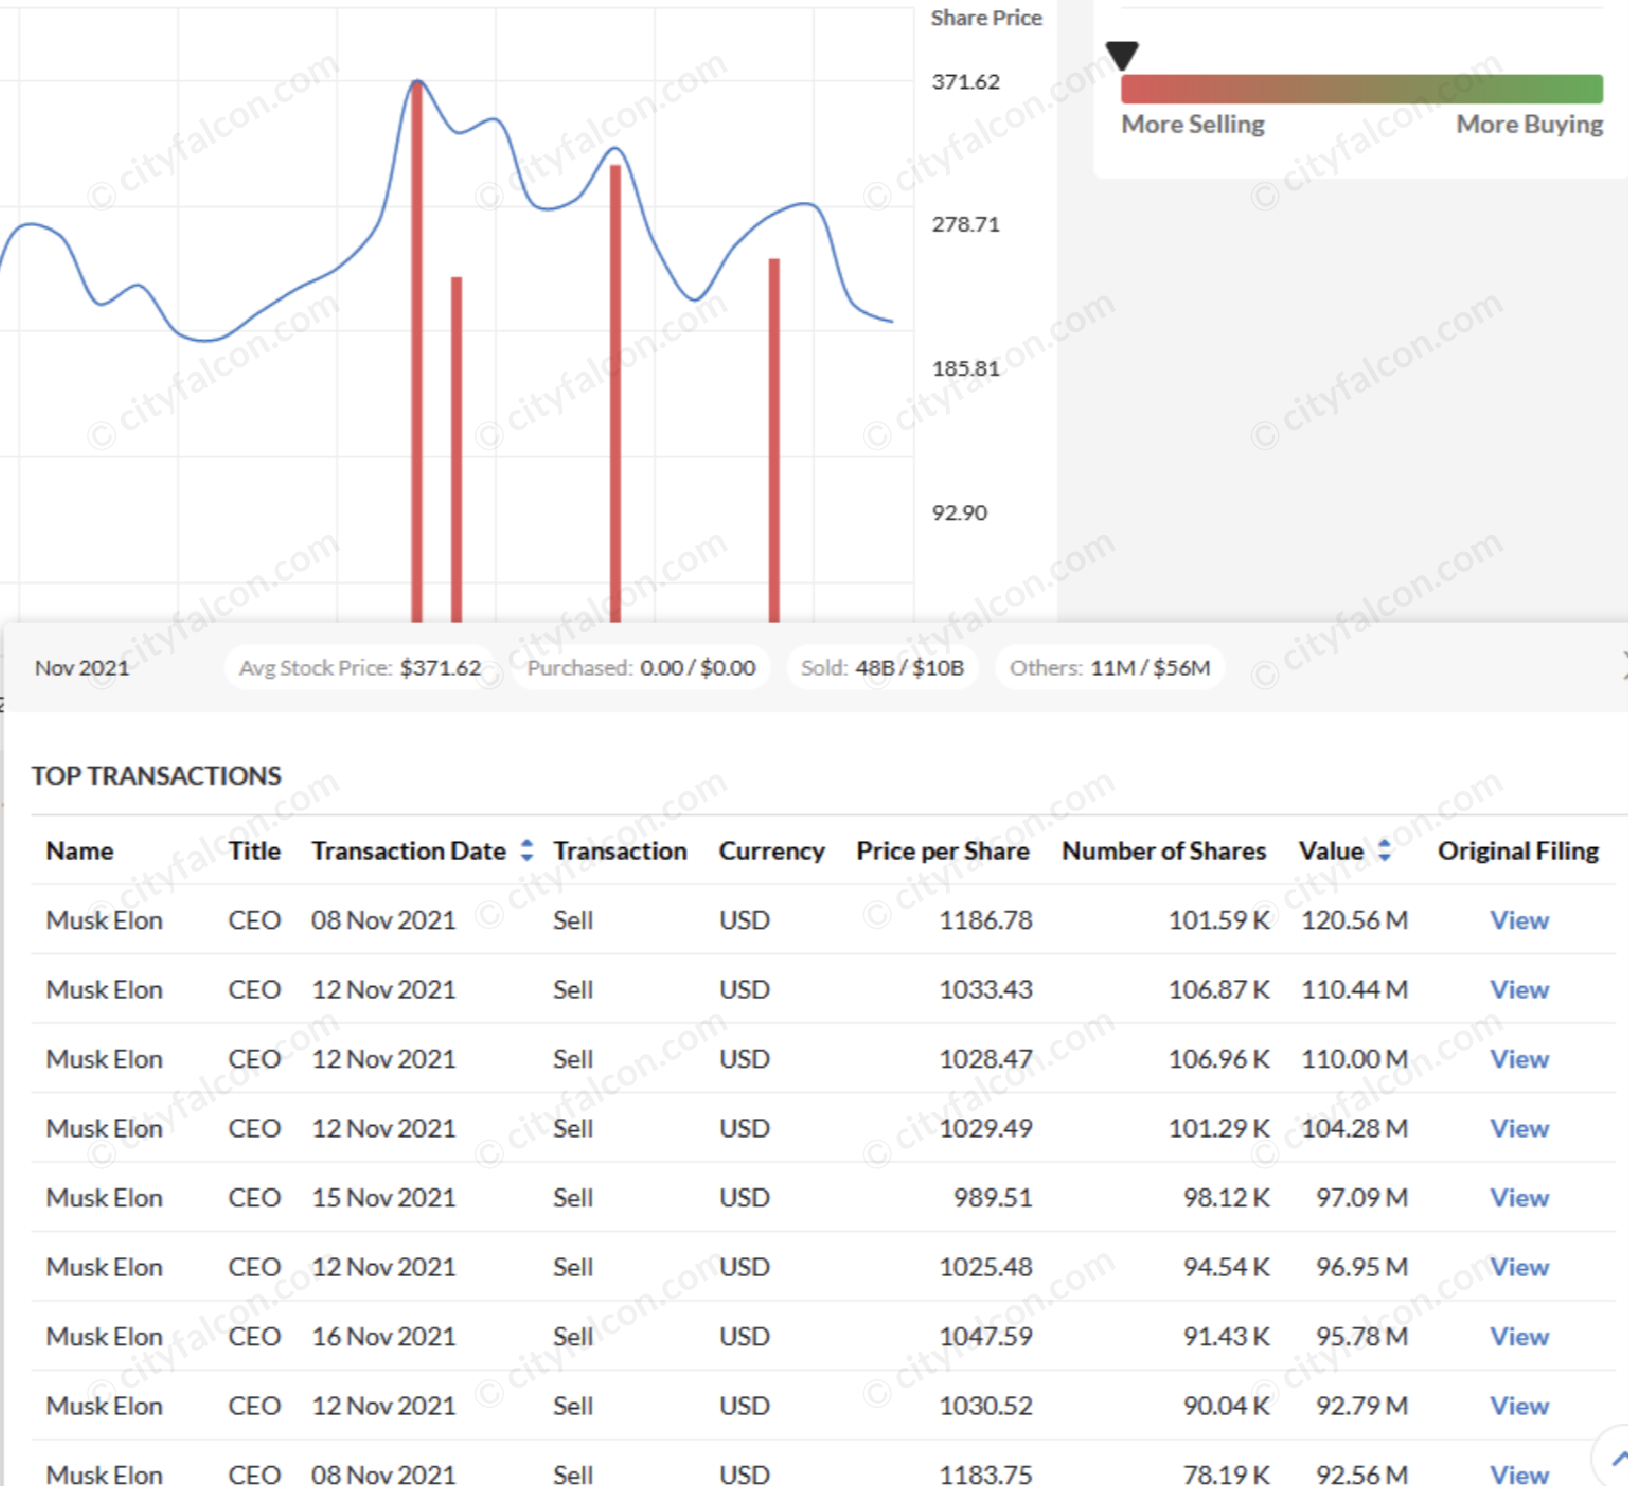
List of top insider transactions on graph point
However, there are still more transactions and reasons to investigate before you come to a conclusion. Hovering the mouse over the graph offers a month by month breakdown of the top transactions, and lets you know the timing. Basically, there are three “waves” of selling. The first one from October to December 2021, the second one during June 2022, and the third one during August 2022.
As a next step, you can shift to the news section, where we aggregate 13,000 sources of news, and you can filter them for these specific periods. With our Gold Plan (see pricing here), you gain full text of selected content from 1000+ sources, without paywalls or advertising. It’s even easier to shift to the Charts & Data tab and just hover over the price graph, which displays the top news at each price point. Matching up the dates and prices, you know that the last part of selling may be linked to the Twitter deal. Magic, isn’t it?
Hovering news over Tesla’s stock chart
You can do exactly the same with our sentiment trend graph, under the news section. In the event of slowing orders or some other influential news, the sentiment can give hints that are not as apparent on the price graph, so it is a good idea to check both.
Hovering your mouse over those two graphs, you see what was going on throughout the time period, and how these events affected the stock price and the sentiment. If you don’t know what sentiment is, our Sentiment Analysis breaks text down into its constituent sentences and maps the language of those sentences to the corresponding level of optimism or pessimism. For example, the sentence “Tesla stock price crushed on slowing orders from China” would certainly be a negative sentence, and because changes in sentiment can impart strong signals, it is one of the most popular features for users and enterprise API clients. More details on this feature here.
Apart from investigating insider transactions, which is the scope of this post, the graphs with the hovering news is an amazing tool by itself. You see spikes, downfalls, or turning points, and you instantly know the possible reasons, the related events, and how the press covered them. You can also see it as a modern interactive chronicle for every listed company. We cannot hide our enthusiasm about this feature!
Zoom: Insiders have been sellers
Zoom (ZM) was one of the most loved stocks during the pandemic. The stock peaked above $500 in October, 2020, compared to the ~$70 it traded at at the start of that year. Did you know that while the masses were buying the stock, the insiders were unloading?
Zoom’s Insider Transactions since the IPO
It is intriguing to see such a large number of insiders being sellers, and almost none of them being buyers. It is also interesting to study the pace of the selling activity over time.
Top Aggregated Transactions of Zoom’s insiders during the previous 5 years
Before the lockdowns started, work from home and Zoom calls were not popular and widely known, except for people working in the tech industry. According to the available information at the time, and without knowing what the would future hold, the insiders felt that the stock was decently valued, and as their trading activity suggests, they took some chips off the table in the pre-pandemic period.
Then COVID hit, and with the lockdowns, the management noticed the dramatic increase in the app’s usage and the spectacular prospects. It is not a coincidence that insider selling significantly reduced in volume just after April 2020, allowing insiders to retain equity as the price rose.
Indeed, Zoom’s revenue skyrocketed from $623 million in FY 2020 to $4.1 billion in FY 2022, as their FY 2022 Annual Report data suggest.
Source: Zoom’s FY 2022 Annual Report
On CityFALCON, you’ll find the Annual Report along with all of Zoom’s official investor relations documents. Keep in mind that our content and tools are also accessible from our mobile app, which you can download for free (full, unrestricted access requires a Gold plan).
The IR Section on our Mobile App
Equally, it is thought-provoking that when the stock went higher and higher to overvalued levels, beyond what reasonable expectations could justify, insider selling increased again. With the stock still close to the top, and with looming signs of a slowdown in growth, insider selling peaked in March 2021.
Zoom Insiders Transactions during the past year
Insider activity continued for a few more months, but when the stock fell below $100, the insiders significantly reduced their sells. Potential insider buys in the future may indicate that some directors start seeing the stock as attractive. By using our tools, you can be more aware of the situation and avoid missing out.
In Summary
CityFALCON subscribes have access to Insider Transactions, news from 13k sources and Twitter, sentiment, key headlines, regulatory filings, and other data feeds for improving portfolio management. We turn the raw data into structured feeds and visuals, analysable at a glance, or feed them via API to our clients, like Etoro and Shares.io. Some clients display this content to their users, while some clients use the content algorithmically. Get a web/mobile plan or get the data through our commercial API.
With our years of experience and our agile team, we can also assist enterprise clients with custom projects that leverage this data, too. Contact Us for bespoke solutions.
The stock market is an extremely competitive arena, and the small investor has an informational disadvantage. With our Insider Transactions tool we aim to narrow it. By using our technology, you can better access and analyse the way insiders buy and sell shares in the companies they lead. Combining that with our other tools, you gain a great advantage as an investor, trader, wealth manager, broker, or other market participant.
Happy investing, trading, and money making!
Leave a Reply